More...
617-529-2913
20 Adams Street | Suite 200 | Boston, MA 02129

Tag Archives: equities

Never let all the political chatter get in the way of the bull

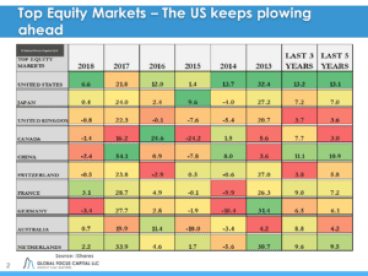
Global equity markets keep moving ahead despite the massive political noise. After falling in the middle of the pack last year, US equity markets remain in the pole position this year.

Some notable developments last week:

  • The US lagged international developed and emerging markets as the US dollar took a bit of a breather
  • Tech for once did not lead the markets. In fact, it was the worst performing sector. Facebook was the main contributing factor.
  • Value and yield strategies rebounded strongly.
  • Mega caps outperformed in the US.
  • Most stocks were down last week but the cap weighting of broad indices made things look better. The S& P 500 was up 61 bp while the Russell 2000 was down almost 2%.

What we are watching this week:

  • Lots of earnings in the US (Notables: Apple, Pfizer, Caterpillar, Tesla, Eaton)
  • Risk Aversion – expect the RAI to jump into the Neutral Zone. Investors keep under-pricing risk
  • Market Internals – expected to remain “balanced”. The technical do not support a bear market
  • Q: What will US markets do after the strong 4.1% GDP growth? Will the long rate stand up?
  • Will the US dollar give up some ground? The policy of super easy money seems to be coming to an end in JP and Europe
  • Will Facebook rebound?

Interested in reading our full report?

Subscribe to our free weekly Equity Observer to get the report delivered to your email.

Eric J. Weigel

Global Focus Capital LLC

Keeping It Real – The Impact of Fees, Taxes and Inflation

Real Stock ChartWhat’s more important to investors than real returns? 

In a previous note (Leaving Money on the Table) we wrote about the impact of taxes and fees on net strategy returns. Our focus was more conceptual and we highlighted the highly customized nature of after-tax portfolio management advice.

Some of our readers, however, remembered empirical work we had done a number of years back using broad US stock and bond market returns. We decided to update our previous research on the effect of taxes, fees and inflation on the real return to investors.

Our methodology is simple.  By necessity we employ some simplifying assumptions regarding fees and taxes. We use S&P 500 and US Government Ten-Year Note returns from the end of 1982 to the end of 2015.

We subtract three levels of “costs” from gross returns:

  • Management Fees
  • Taxes (short and long-term)
  • Purchasing Power (inflation)

Real Stock ReturnsReal Bond Returns


The results are eye opening and a timely reminder of the drag on investment returns.  A lot of investors would be surprised to see the extent of this drag on their portfolios but in the real world the results may actually turn out to be even worse. 

Why? For one many investors pay high fees on their portfolios and ignore the tax efficiency of their strategies.

While not as sexy as a discussion of strategy returns or smart beta minimizing the extent of the cost drag from fees, taxes and loss of purchasing power is an important part of sustained wealth creation

 Management fees on portfolios should be scrutinized for value add.  Portfolio management has a cost. Index strategies are now available on most market segments in equity and fixed income markets at low cost but the combination of strategies and overall asset allocation still needs to be managed.

Jack Bogle has been talking about the importance of controlling fees for years and investors as a group may have become recently more fee sensitive especially as the realization sinks in that we are most likely going to be living in a low return environment for the next decade.

Paying high fees in a low return environment would certainly impair wealth accumulation targets.  Paying fees commensurate with value add should be the goal of investors.

As Benjamin Franklin once said, taxes are as certain as death and as such the best that one can do is minimize the tax bite of investment strategies. Tax loss harvesting, low portfolio turnover, proper strategy selection, and legal deferment of taxable events are elements of a coherent well-designed tax minimization strategy.

Finally, a huge drag on net real returns has been the loss of purchasing power. While inflation in recent years has been below historical norms the loss of purchasing power can best be thought of as an almost invisible downward pull on wealth creation efforts.

Not all investment strategies behave in the same manner in the face of inflationary forces.  Properly aligning investment strategies to the expected inflationary environment is an important component of minimizing the deleterious effects of a loss of purchasing power.

 If you would like to read our full report please fill out the information below and hit the Send button

    Your Name (required)

    Your Email (required)

    Eric J. Weigel

    Managing Partner, Global Focus Capital LLC

    Feel free to contact us at Global Focus Capital LLC (mailto:eweigel@gf-cap.com or visit our website at https://gf-cap.com to find out more about our asset management strategies, consulting/OCIO solutions, and research subscriptions.

    DISCLAIMER: NOTHING HEREIN SHALL BE CONSTRUED AS INVESTMENT ADVICE, A RECOMMENDATION OR SOLICITATION TO BUY OR SELL ANY SECURITY. PAST PERFORMANCE DOES NOT PREDICT OR GUARANTEE FUTURE SIMILAR RESULTS. SEEK THE ADVICE OF AN INVESTMENT MANAGER, LAWYER AND ACCOUNTANT BEFORE YOU INVEST. DON’T RELY ON ANYTHING HEREIN. DO YOUR OWN HOMEWORK. THIS IS FOR INFORMATIONAL PURPOSES ONLY AND DOES NOT CONSIDER THE INVESTMENT NEEDS OR SUITABILITY OF ANY INDIVIDUAL. THERE IS NO PROMISE TO CORRECT ANY ERRORS OR OMISSIONS OR NOTIFY THE READER OF ANY SUCH ERRORS

    Low Volatility – One Factor or Several?

    park-bench-waterfall-1202609-639x427Once a month in our Equity Observer  publication we share our analysis of what stock selection factors are working.  This year the best performing factor in our global sample is “low volatility”.

    The issue of what constitutes a factor will be endlessly debated, but while “low vol” does not quite rank up there among academics with the original Fama-French-Carhart variables (market, size, value, momentum) there is nevertheless a growing investor demand for lower volatility strategies.

    The growing demand for “low vol” strategies does not seem entirely driven by the performance of these strategies relative to core benchmarks.  For example over the 2015-2013 period the S&P Low Volatility Index under-performed the S&P 500 core index by 3.4% annualized.  Yet demand for these strategies appears to have grown as manifested by the large number of new ETF’s launches in this space.

    Investors seem particularly interested in the capital preservation characteristics of “low vol” strategies and appear willing to sacrifice returns during the good times in return for less pronounced equity market downdrafts.

    Low volatility strategies seem here to stay.  Given their market beating returns thus far in 2016 it is reasonable to expect growing interest.  We therefore analyze our global sample of 13,000 stocks to ascertain the basic characteristics of low volatility stocks. Vol_decile

    Stocks in the lowest volatility decile have an average return volatility of 20%

    Higher volatility stocks exhibit low levels of market sensitivity (beta)

    During periods of equity market stress ‘low vol” strategies should out-perform broad market indices

    The lowest volatility decile enjoys the highest current yields while the “high vol” names in Decile 10 barely register for income

    Lower volatility stocks have lost their historical valuation advantages.  The growing demand for ‘low vol” and its close cousin dividend income have eroded the typically lower valuations seen in lower volatility sectors and stocks.

    low vol returnsEven after adjusting for sector and region/country effects we observe a strong monotonic relationship in YTD returns across volatility deciles.

    The lowest volatility stocks (Decile 1) have had the highest 2016 returns while the highest volatility stocks have shown the greatest losses.


    Our general conclusion is that “low volatility” strategies play a useful role for investors looking to provide short-term downward protection in their equity portfolios.  However, we think of “low vol” as part of a package of stock attributes designed to lessen market exposure during periods of equity market stress.  These strategies along with lower betas, higher yields and exposure to more stable sectors should exhibit lower levels of downside capture.

    Investors worried about equity market downturns should not view these strategies as a substitute for properly assessing and managing the risk of their overall portfolios.

    Click here to download the report: Low Volatility – One Factor or Several?

    Sincerely,

    Eric J. Weigel
    Managing Partner and Founder of Global Focus Capital LLC

    eweigel@gf-cap.com

    Global-Logo

    From Bear Market to Sector Rotation – It’s All a Bit Confusing Now!

    This year has been a roller coaster for global equity investors. From the weak start to the year to the recovery in early March it has left investors with more questions than answers.  Are we in a bear market? Are we just pausing until global growth resumes?

    Lots of questions and few answers, but maybe we can distill some useful information from the recent price action of global equity markets. In a world where the headlines revolve around broad market indices such as the S&P 500 or the Nikkei 225 much is left unexplored.

    In this note we look at the technical characteristics of our global equity sample (13,000 stocks) for clues as to what may be going on behind the scenes. We search the readings from our Technical Stage Model for clues. For further details on our methodology please read our post Getting All Technical

    technical stages chart

    What we find is great investor indecision – over 40% of stocks in our global sample reside in the Improving Stage.  

    While historically one would expect these stocks to keep on moving up higher to the Break Out Stage there is also a non-trivial probability of regressing to the Down Turn Stage hence our characterization of the Improving Stage as indecisive.

    We also find a strong rotation away from sectors and equity styles that out-performed last year toward much maligned resource-oriented sectors and countries.

    Is the current technical picture more consistent with a Bear Market or an ongoing strong sector rotation toward out-of-favor sectors?  Will the recovery in resource- oriented sectors last?

    Click here to download the report:Strong Sector Rotation or a Bear Market?

    Sincerely,

    Eric J. Weigel
    Managing Partner and Founder of Global Focus Capital LLC

    eweigel@gf-cap.com

    Global-Logo

    Can This Russian Bear Learn To Samba?

    I have my own moves!

    Last week we wrote about the amazing year to date performance of the Brazilian equity market. Despite all the awful headlines and negative investor sentiment the Brazilian market was up over 20% and last week it went up a further 4%.

    A similarly widely disliked equity market fraught with negative headlines having a great start to the year is Russia.

    Russian equities were up 2.5% last week and in 2016 they are up about 11%. Not bad for a market that like Brazil comes with lots and lots of baggage.

    All resource-oriented equity markets have benefited from the resurgence of commodities and both economies are expected to contract further in 2016, but Russia and Brazil are not cut from the same cloth.

    There are at least three key differences that investors should note before lumping these emerging markets together:

    • Economic Sector Composition
    • Fundamental Drivers of Return
    • Value Add of Top-Down versus Bottom-Up Implementation Approaches

    Click to read the full report  Can This Russian Bear Learn To Samba?

    Sincerely,

    Eric J. Weigel
    Managing Partner of Global Focus Capital LLC

    eweigel@gf-cap.com

    Global-Logo

    Beyond the Fog of Daily Capital Markets

    foggy-mountains-1503271-1279x1926As an active manager one of the toughest psychological tasks is to invest for the long-term but have to deal with the daily noise and chatter of the markets.  The unrealistic expectation of having superior performance over all measurable holding periods leads to behavior often inconsistent with the goal of prudent long-term capital accumulation.

    Given the volatility of capital markets a lot can happen over the short-term that over time gets washed away and becomes a mere blip on the radar. Conversely, other things that in the hustle and bustle of the markets seem minor turn out to be much more impactful over the long-term.  Empirical research shows that returns typically are more volatile in the short-term than warranted by changing fundamentals.  The net result is a lot of noise that dissipates once investors take a longer term view.

    Taking a Step Back.  In recent years we have started thinking that stepping back a bit and watching the whole landscape unfold perhaps gives us a better sense of what really matters.

    As archaic as this may sound to a high frequency trader in our research we have started focusing more on looking at company and capital market fundamentals over longer time periods.  Looking for example at year by year annual company financials gives us a better sense where business fundamentals are going.  Same with broad capital market relationships at the asset class level.  Aggregating annual periods to look at secular trends gives us another way to process information in a manner that may seem old-fashioned but that hopefully removes some of the noise.

    Shifting our Focus toward Long-Term Performance.  We recently put together heat maps of annual performance for a variety of capital market breakdowns.  We looked across the major asset classes as well as within each asset class.  The results were revealing in each case.  We found a lot of surprises especially when looking at cumulative returns over the last ten years!

    In this note I will share the heat map for the ten major asset classes used in our asset allocation strategies.  The returns for 2016 are as of January 22.  All returns are in US dollars and correspond to commonly used indices.

    2015 ASSET MIX HEAT MAP

    What We Expected:

    • Lots of variability from year to year – this we expected. After all this is the point of creating a heat map.
    • We did not see a lot of relative mean reversion over one or two calendar years. Again this was expected given the strong empirical evidence that momentum persists for up to three years. We did not see a lot of “going from worst to best” or vice versa.
    • Not all higher risk categories outperformed lower risk assets – this we expected given the hits suffered by equity-oriented assets during the Financial Crisis. For example, US bonds have out-performed international equity investments over the last ten years.  Needless to say this was achieved with much lower volatility.
    • US stocks had below average ten-year returns. The annualized return on US Large Caps (S&P 500) was 7.7%, more than 2% below historical averages. US Bonds (Barclay Aggregate) also had below average returns compared to history.

    What Surprised Us?

    • A big surprise was the extremely poor performance of commodities (COM) – down 48% over the last ten years. For most investors the promise of uncorrelated returns to the stock market has come at a very high price.  Bye-bye commodity super-cycle!
    • I was also surprised by the 2X out-performance of US stocks compared to international equity indices. Some was due to currency but not all. There were major geographic performance differences over the last ten years.
    • US REITS (RE) edged out US large cap stocks by a slight margin over the last ten years. We expected a larger margin of out-performance but we had forgotten that in 2007 REITS were a precursor to what would happen during the Financial Crisis.
    • Emerging Market Debt proved to be a revealing surprise with a 97% total return. Pretty close to US equity market returns and vastly superior to international equities. Much lower volatility too.
    • The 91.7% return to the 60% S&P 500/40% Barclay Aggregate portfolio. The balanced portfolio lagged the S&P 500 by only 0.59% on an annualized basis but with much lower short-term volatility. Not bad for such a simple portfolio.

    Insights to Share:

    • The short-term noise in the capital markets can obfuscate long-term secular changes as well as disproportionally focus the mind on events that over the long-term have little to no significance.
    • Expect lots of variability from year to year in terms of performance but over longer-term periods asset values will converge toward the fundamental drivers of return – income generation, growth and valuation.
    • To reinforce the previous point, a lot of capital market volatility is just noise and should be ignored unless there is a change to fundamentals.
    • Simple strategies such as the annually rebalanced 60/40 portfolio can prove sometimes incredibly effective at managing through the daily fog of markets
    • Effectively distinguishing noise from fundamental signal is the key goal of capital market research. Capital markets are always evolving but the fundamental drivers of return and associated risk should be the backbone guiding your perspectives.

    Sincerely,

    Eric J. Weigel

    Managing Partner and Founder of Global Focus Capital LLC

    eweigel@gf-cap.com

    HTML Snippets Powered By : XYZScripts.com