More...
617-529-2913
20 Adams Street | Suite 200 | Boston, MA 02129

Category Archives: Equity Strategies

Yikes – The Asset Class with the Best Long-Term Prospects is Imploding

Weekly Equity Market Highlights

  • Global equities under-performed bonds by a wide margin over the last 5 trading days
  • EM equities, in particular, are taking a huge hit – down almost 6% in the last 5 days
  • We rate EM equities as having the best long-term prospects but yikes, this hurts
  • Chinese stocks are imploding – is this all about a trade war or more significant trade issues?
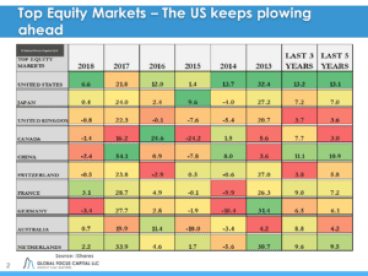
  • Year-to-date US equities are vastly out-performing international assets – strong home bias plus an appreciating US dollar
  • Earnings season in the US is almost over – a good season was had by most
  • Value lost less than Growth in the US last week – is that out-performance?
  • Low volatility and high yield had gained last week but value indices were down


Countries & Region:

  • Tough week all around with the US losing the least
  • EM equities have been on a downward trend this year and it got worse this week with the index down 5.3%
  • China’s equity market continues to be very volatile. Trade war jitters have had a much larger effect on Chinese stocks – stocks were down over 6% in the last 5 days
  • Global sectors had losses except for Utilities and Staples – a tough week overall
  • Energy stocks keep getting whipsawed by the commodity


Style & Sector:

  • In the US, low vol and dividend yield were winners over the last 5 trading days
  • The “Value” comeback seems highly dependent on the path of interest rates
    • When people worry about rising rates “value” stocks take a hit, when they don’t they do well
  • Momentum took a hit last week – this style is quickly losing steam but still remains top dog for 2018
  • EM and International Developed equities continue their down trend
  • A big factor in relative performance rankings is the direction of the US dollar

This Coming Week:

  • Risk Aversion – expect the RAI to jump into the Neutral Zone
    • Investors keep under-pricing risk
  • Will value only outperform growth when interest rates in the US drop?
    • Will EM equities recover? The Turkey currency crisis merits some attention. Watch out for contagion effects
  • Are Chinese equities going to implode or is this temporary? Is the down trend due to tariffs or domestic growth issues?

To read our weekly report including style factor breakdowns please click  here

Eric J. Weigel

Global Focus Capital LLC

eweigel@gf-cap.com

___________________________________________________________________________________

Publications:

Weekly Asset Allocation Review – Free

Weekly Equity Themes Review – Free

The Equity Observer (Monthly) – Subscription Required

The Asset Allocation Advisor (Monthly) – Subscription Required


Weekly Equity Market Highlights – Where is the Bear?

Weekly Equity Market Highlights

  • Global equities outperformed bonds by a wide margin over the last 5 trading days
  • Where is the Bear? We know it is lurking behind the scenes but conditions still favor equities over bonds
  • Emerging market equities were the best-performing equity sub-asset class – a reversal from some dismal prior weeks
  • Year-to-date US equities are vastly out-performing international assets – strong home bias plus an appreciating US dollar
  • Earnings season in the US is almost over – a good season was had by most
  • Growth keeps outperforming value but most of the real action is at the sector level and highly dependant on the interest rate environment
  • China’s equity market continues to be very volatile – Trade war jitters have had a much larger effect on Chinese stocks

Countries & Region:

  • Large caps dominated in the last week with the S&P 500 up 1%
  • EM equities have been on a downtrend this year but last week was up 1.1% – part of it was currency related
  • China’s equity market continues to be very volatile. Trade war jitters have had a much larger effect on Chinese stocks
  • Telecom had a nice recovery last week with the global sector index up 2.7% – people continue searching for yield
  • Tech resumed its upward march while Energy stocks keep getting whipsawed by the commodity

Style & Sector:

  • In the US, momentum and growth keep leaping ahead
  • The “Value” comeback seems highly dependent on the path of interest rates
    • When people worry about rising rates “value” stocks take a hit, when they don’t they do well
  • Size or market cap behaved perversely – the larger the cap the better the performance
  • EM equities out-performed last week with Asia doing particularly well
  • LATAM gave back some of the gains from last week
  • A big factor in relative performance rankings is the direction of the US dollar

This Coming Week:

  • Risk Aversion – expect the RAI to jump into the Neutral Zone – Investors keep under-pricing risk
  • Market Internals – expected to remain “balanced” -the technicals do not support a bear market
  • Will growth keep outperforming value? Much depends on the direction of interest rates
  • Will EM equities recover? The Turkey currency crisis merits some attention. Watch out for contagion effects
  • More tariffs on the horizon? Will US stocks react to this? Most of the effect thus far has been on non-US stocks

To read our weekly report including style factor breakdowns please click here

Eric J. Weigel

Global Focus Capital LLC

eweigel@gf-cap.com

___________________________________________________________________________________

Publications:

Weekly Asset Allocation Review – Free

Weekly Equity Themes Review – Free

The Equity Observer (Monthly) – Subscription Required

The Asset Allocation Advisor (Monthly) – Subscription Required


Never let all the political chatter get in the way of the bull

Global equity markets keep moving ahead despite the massive political noise. After falling in the middle of the pack last year, US equity markets remain in the pole position this year.

Some notable developments last week:

  • The US lagged international developed and emerging markets as the US dollar took a bit of a breather
  • Tech for once did not lead the markets. In fact, it was the worst performing sector. Facebook was the main contributing factor.
  • Value and yield strategies rebounded strongly.
  • Mega caps outperformed in the US.
  • Most stocks were down last week but the cap weighting of broad indices made things look better. The S& P 500 was up 61 bp while the Russell 2000 was down almost 2%.

What we are watching this week:

  • Lots of earnings in the US (Notables: Apple, Pfizer, Caterpillar, Tesla, Eaton)
  • Risk Aversion – expect the RAI to jump into the Neutral Zone. Investors keep under-pricing risk
  • Market Internals – expected to remain “balanced”. The technical do not support a bear market
  • Q: What will US markets do after the strong 4.1% GDP growth? Will the long rate stand up?
  • Will the US dollar give up some ground? The policy of super easy money seems to be coming to an end in JP and Europe
  • Will Facebook rebound?

Interested in reading our full report?

Subscribe to our free weekly Equity Observer to get the report delivered to your email.

Eric J. Weigel

Global Focus Capital LLC

Key Equity Market Insights – Risk Aversion At Work


The Week In Review

  • After a long stretch of not suffering hardly any losses, US investors got a rude awakening to the other side of the return coin – i.e. risk
  • International developed markets had the biggest losses closely followed by Emerging Markets – Japan was down the most of the major markets
  • In the US the biggest hit was experienced by large-cap stocks
  • Stocks in the real estate, telecom and utility sectors have deteriorated the most since the beginning of the year
  • We do not see much rhyme or reason behind last week’s relative style performance – the most liquid stocks got sold the hardest regardless of style – defensive sectors provided little relief
  • While the US equity market is technically in a correction, our proprietary Risk Aversion Index remains in the Neutral Zone -most of the “fear” is emanating from equity market factors and not from bond market or economic health indicators
  • Our view is that this is a technical correction unrelated to market fundamentals. After a historically strong 2017, we see this correction as a reflection of investors wanting to lock in some of their above-average gains from last year

The Daily View

Monday and Thursday were particularly bad for US stockholders

The biggest portion of returns happened from the open to the close

Overnight activity was somewhat muted pointing to the US equity market as the centre of the storm


The range of intraday price action was incredible wide last week

Except for Wednesday the intraday difference between the daily high and low was greater than 4%


The Technical Picture

Stocks in the real estate, telecom and utility sectors have deteriorated the most this year – these sectors are all very interest rate sensitive

About 70% of utilities in the Russell 3000 are in the Down Trend Stage

After a great start to 2018 we are now left with only a handful of stocks in the Up Trend Stage – Health Care and Tech have the most “survivors” in the momentum trade


What We See For This Week:

  • My view is that this is a technical correction and it will be over soon
  • Investors have been conditioned by 2008, but this is different
    • The global economy is growing
    • Inflation is low and inflationary pressures are contained by plenty of slack capacity
    • Monetary policy has followed a predictable path and remains accommodative
  • Earnings – CSCO, AIG, AMAT, PEP, OXY, MRO
  • Risk Aversion – expect the RAI to remain in the Neutral Zone
  • Expect equity and bond volatility to subside, volatility is mean-reverting
  • Look for rebound candidates in Health Care & Energy sectors


To continue reading download the full report here


Eric J. Weigel

Managing Partner, Global Focus Capital LLC


Services

Asset Management:

  • Tactical Asset Allocation
  • Global Long/Short Equity
  • Sustainable Equity

Consulting

  • Portfolio Reviews/Positioning
  • Risk Management
  • ESG

Research Publications

  • The Asset Allocation Advisor
  • The Equity Observer
DISCLAIMER: NOTHING HEREIN SHALL BE CONSTRUED AS INVESTMENT ADVICE, A RECOMMENDATION OR SOLICITATION TO BUY OR SELL ANY SECURITY. PAST PERFORMANCE DOES NOT PREDICT OR GUARANTEE FUTURE SIMILAR RESULTS. SEEK THE ADVICE OF AN INVESTMENT MANAGER, LAWYER AND ACCOUNTANT BEFORE YOU INVEST. DON’T RELY ON ANYTHING HEREIN. DO YOUR OWN HOMEWORK. THIS IS FOR INFORMATIONAL PURPOSES ONLY AND DOES NOT CONSIDER THE INVESTMENT NEEDS OR SUITABILITY OF ANY INDIVIDUAL. THERE IS NO PROMISE TO CORRECT ANY ERRORS OR OMISSIONS OR NOTIFY THE READER OF ANY SUCH ERRORS


Is Hope The Only Active Strategy Left?

There are so many stories going on in the press about the demise of the active management industry that one gets the impression that every portfolio manager must be feeling like a gambler pawning his last possession.

I recently attended a wealth management forum put together by Marketwatch were the commonly held view among attendees and panelists was that active management is dead and that the whole investment industry has been commoditized.

Certainly when evaluating security selection strategies relative to passively constructed benchmarks the recent record of active management leaves a lot to be desired. Times have been tough for active management shops and investors have been flocking to a myriad of index strategies. Exchange-traded funds (ETF) and multi-asset class strategies such as Target Date Funds have been the primary beneficiaries.

Barron’s magazine recently reported that only 33 percent of active equity managers managed to beat their benchmark last year. Outflows from actively managed strategies surpassed $288 billion (through November) – worse even than for 2008.

The popular S&P SPIVA report shows that the situation is not any better if one looks at a longer time period.  For example, as of June of 2016, only 8 percent of US large cap strategies managed to beat the S&P 500 index over the trailing five years.

Midcap and small cap managers did not fare any differently.  How about REIT managers? Not really – only about 11 percent of active strategies beat their index over the last five years.

International equity managers did fare a bit better than their US counterparts with close to 40 percent beating their index over the last five years.  32 percent of emerging market equity managers likewise beat their benchmark. A bit more hopeful but still nothing to write home about!

What about fixed income active strategies? A bit better in smaller pockets of the markets such as municipals, short and intermediate term investment grade where the majority of funds had higher returns than their corresponding index.

But among longer maturity strategies the situation was as abysmal as for equity managers. For example, only 3.5% of Long Government strategies outperformed over the trailing five years.  Even in the emerging market debt category only 8 percent of active strategies outperformed.

Is hope the only strategy left for the active investor? Just like the gambler down to his last pennies it sure feels lonely out there. All active management friends seemed to have slithered out the back door.

If the data cannot be tortured to confess, what about using theory to defend active management? Unfortunately, little help seems to be coming from the halls of academia.  Many years ago Bill Sharpe published his famous paper on “The Arithmetic of Active Management”.  The basic idea that active managers bear higher costs than passive investors thus creating a wedge in performance between the two has stuck as a reasonable theoretical explanation for the under-performance of  active management.

Recently, there has been some debate about some of the logic used by Sharpe (see the recent Lasse Pedersen paper) but in general while it is clear that index funds are not totally passive (due to new issues, repurchases, and index membership changes) the consensus still seems to be that the basic disadvantage of active management is due to its higher costs.

Another argument working against active management was espoused by another Nobel Prize winner Paul Samuelson even longer ago.  Samuelson held that the stock market is micro-efficient, but macro-inefficient. 

What this means is that at the level of individual stocks (where active managers ply their trade) it is much harder to beat the overall market but that the market itself may occasionally exhibit economically significant deviations from fundamental value.  Research by Jung and Shiller at Yale corroborates the Samuelson story of micro-efficiency and macro-inefficiency.

Every active manager knows that outperforming benchmarks is tough especially in a consistent manner.  A quote by Charlie Ellis of Greenwich Associates has stuck with me over the years. While I can’t remember the exact wording it goes something like this – “outperforming is difficult not because investors are stupid but because they are smart and compete with each other”.

I might have butchered Charlie’s quote but the basic idea is that with so many smart people participating in the markets today active management has become at least conceptually a zero sum game with the additional handicap of higher costs.

What this means is that on a capital weighted basis for every winner there must be a loser (assuming a fairly static market portfolio) but both must bear the burden of higher costs.  These costs are especially detrimental in an environment of lower capital market returns such as the one currently anticipated by Global Focus Capital.

Given all the evidence against active management what is the investor to do? Load up on ETF’s and run away from actively managed strategies?  The flow of funds data certainly seems to be confirming this behavior.  Active equity and bond managers have seen massive outflows to their strategies while flows to ETF’s have grown consistently for over ten years.

Continue reading

Sincerely,

Eric J. Weigel

Managing Partner, Global Focus Capital LLC


DISCLAIMER: NOTHING HEREIN SHALL BE CONSTRUED AS INVESTMENT ADVICE, A RECOMMENDATION OR SOLICITATION TO BUY OR SELL ANY SECURITY. PAST PERFORMANCE DOES NOT PREDICT OR GUARANTEE FUTURE SIMILAR RESULTS. SEEK THE ADVICE OF AN INVESTMENT MANAGER, LAWYER AND ACCOUNTANT BEFORE YOU INVEST. DON’T RELY ON ANYTHING HEREIN. DO YOUR OWN HOMEWORK. THIS IS FOR INFORMATIONAL PURPOSES ONLY AND DOES NOT CONSIDER THE INVESTMENT NEEDS OR SUITABILITY OF ANY INDIVIDUAL. THERE IS NO PROMISE TO CORRECT ANY ERRORS OR OMISSIONS OR NOTIFY THE READER OF ANY SUCH ERROR


Cutting US Corporate Tax Rates

taxpapers-1557352-639x852In this US electoral season the issue of corporate tax reform comes up frequently. Both parties seem to understand the competitive disadvantage in which US corporations find themselves often due to much more generous tax policies in other countries.

Where does the US stand in terms of corporate tax rates? KPMG, the large accounting firm, provides an excellent guide to Global Corporate Tax Rates . The current corporate tax rate for US domiciled companies is shown as 40% which is composed of the top federal rate of 35% plus applicable state and local authority taxes.  The KPMG guide is meant as a guide but clearly the ultimate corporate tax rate faced by companies is a function of many variables including importantly the location of foreign subsidiaries.

According to the KPMG data the US ranks highest in terms of corporate tax rates among major industrialized nations.  The global average in the KPMG sample is 23.6% with rates in OECD countries slightly higher at 24.8%.

In the last ten years there has been a race to the bottom in terms of corporate tax rates.  Countries have been lowering their tax rates as an incentive for companies to relocate to their jurisdictions.  In the KPMG sample we find seven countries with a zero corporate tax rate.  Some well-known tax locales with no corporate taxes include Bahamas, Bermuda, Guernsey and the Isle of Man.

What are the investment implications of lower US corporate taxes?  Lower corporate taxes would most likely make US domiciled companies more valuable as after-tax profitability would be enhanced.  By how much? To address this question we resort to using a simple discounted cash flow approach.

The basic idea behind using a discounted cash flow approach relies on using estimates of future cash flows to the company and discounting those cash flows back to the present by using the weighted cost of capital.

Our analysis is based on a discounted cash flow model built for a hypothetical company where the only two parameter inputs that we vary are the applicable corporate tax rate and the level of debt financing.  What do we learn from this exercise?

From a pure valuation perspective it is unambiguous that a lower corporate tax rate will result in greater gains for shareholders. Basically, the revenue foregone by tax authorities is now available to shareholders of the company.

But there is an offset in the valuation model via the discount factor of those now higher corporate cash flows.  Specifically, assuming the same capital structure, the cost of capital will increase as the tax advantages of debt financing are diminished.

Say corporate taxes go from 35% to 20%.  The after-tax cost of debt to the company yielding 5% goes from 3.25% to 4% (the calculation is (1-Tax rate)*Yield).  The net effect of lower corporate taxes is a higher weighted cost of capital (assuming no changes to the capital structure or risk profile of the business). A higher cost of capital implies lower a lower valuation assuming unchanged cash flows to equity holders.

The offsetting impact of a higher cost of capital in discounting cash flows is under most scenarios likely to be of lesser importance to the valuation of the firm compared to the value enhancing effect of higher after tax cash flows

Some of our conclusions:

  • A lower corporate tax rate will under most scenarios result in higher firm valuations
  • The effects of tax cuts are non-linear as the first few percentage points of tax cuts lead to proportionally higher rates of firm value appreciation
    • Going from a 35 to a 30% tax rate results in a greater increase in firm valuation than going from a 30 to a 25% tax rate
  • Firms using more debt financing will benefit from lower tax rates but less so compared to firms who do not use debt very much
    • Firms with low debt to equity in their capital structures will increase the most in value
    • This is due to the diminished value of the deductibility of interest expense and the increase in the weighted cost of capital
  • Companies in the Health Care and Technology sectors typically rely less on debt financing and will thus benefit the most from lower corporate taxes
  • Firms in industries with traditionally high levels of debt financing such as Telecom and Financials will benefit the least from a valuation perspective
  • Firms with significant tax loss carry-forwards will not be as enticing to merge with as the value of their tax credits are diminished under lower corporate tax rates
  • We don’t believe that foreign cash repatriation will instantaneously convince US corporations to invest more domestically

To access the full report click here!


Eric J. Weigel

Managing Partner, Global Focus Capital LLC

Feel free to contact us at Global Focus Capital LLC (mailto:eweigel@gf-cap.com or visit our website at https://gf-cap.com to find out more about our asset management strategies, consulting/OCIO solutions, and research subscriptions.

DISCLAIMER: NOTHING HEREIN SHALL BE CONSTRUED AS INVESTMENT ADVICE, A RECOMMENDATION OR SOLICITATION TO BUY OR SELL ANY SECURITY. PAST PERFORMANCE DOES NOT PREDICT OR GUARANTEE FUTURE SIMILAR RESULTS. SEEK THE ADVICE OF AN INVESTMENT MANAGER, LAWYER AND ACCOUNTANT BEFORE YOU INVEST. DON’T RELY ON ANYTHING HEREIN. DO YOUR OWN HOMEWORK. THIS IS FOR INFORMATIONAL PURPOSES ONLY AND DOES NOT CONSIDER THE INVESTMENT NEEDS OR SUITABILITY OF ANY INDIVIDUAL. THERE IS NO PROMISE TO CORRECT ANY ERRORS OR OMISSIONS OR NOTIFY THE READER OF ANY SUCH ERRORS


Migration Patterns in Company Profitability

ROE's Tend to be Pretty Stable

ROE’s Tend to be Pretty Stable

Firm profitability is a characteristic highly sought out by investors in private market transactions.  In public markets firm profitability tends to be frequently lumped together among “quality” factors.

Over the years I have always thought that “quality” is very much in the eye of the beholder while profitability as a concept can be measured in an unambiguous manner and stand on its own feet.

That is why in our stock selection and top-down sector and country allocation models we treat profitability as a separate conceptual category.

After all what more powerful combination can one have for long-term value creation than a company that is growing and doing so in a profitable way.  Some of the best known stocks in the world such as Apple and Google are living proof that a combination of growth and profitability is highly rewarding for long-term investors.

While market-wide ROE’s tend to be pretty stable across time we would expect some variability caused by the business cycle, the degree of leverage in the system, changes in the cost of money and tax rates among others.  The above chart shows the year-to-year median ROE along with points along the 3rd and 1st quartiles.  The average calendar year ROE in our global sample is 11.2 with a standard deviation of 2.1.

The conventional wisdom holds that in a competitive economy it is virtually impossible to remain a highly profitable company over the long-term.

In the case of a frictionless free market system, companies should all gravitate long-term to an economy-wide level of profitability.  The idea is that companies that are currently below a normal level of profitability will restructure and/or change their business strategy thus hopefully improving profitability.  Conversely, companies with above average levels of profitability will face increased competitive forces and revert back over time to a normal level of profitability.

In a free market open economy company profitability will exhibit a mean reverting pattern.  That is in theory. In the real world of partially competitive markets we would still expect to see mean reverting levels of profitability but with a lot more noise. We would also expect to see stronger mean reverting patterns over longer holding periods while in the short-term we would expect to see minimal competitive re-alignment.

In this note we present some high level findings on how Return on Equity (ROE), a common measure of firm profitability, evolves over time. ROE is calculated as Net Income / Shareholder Equity. For some background on what motivated our interest in profitability factors please take a look at a recent video Eric J. Weigel – The Manual of Ideas Interview available on YouTube.

What does the data show in terms of how companies migrate between profitability stages?

ROE MIGRATION MATRIX

Note: Decile 1 contains the highest ROE stocks in our balanced panel global equity sample

Some high level conclusions:

  • ROEs do not fluctuate that much over time and there is a high persistence in relative universe profitability rankings. We call this the “status quo” effect
    • Mean reversion in ROE (estimated over a five year window) is best found in the middle portion (Deciles 4-6) of the profitability spectrum
  • The highest ROE stocks tend to, over the subsequent five years, remain in the higher portions of our sample profitability at a greater rate than expected.
    • Buying a high ROE stock and five years down the road ending up with a company in the bottom end of profitability occurs with a frequency less than expected by pure chance
    • Deciles 2 and 3 appear to be the place for finding companies with high sustainable levels of relative profitability
  • The greatest rate of improvement in relative profitability rankings occurs in Decile 10 comprising those companies with the lowest ROEs, but the rate of improvement fails to beat expectations. Going long Decile 10 stocks is fraught with significant risk of disappointment
  • A contrarian investor investing in low relative ROE stocks such as those in Deciles 7-9 is taking a bet with unfavorable odds of success. The improvement rate of these ROE laggards tends to fall below expectations

As a final note, our view is that stock picking is a multi-dimensional endeavor balancing among others valuation, profitability, and growth concepts.  The behavior of any one factor should always be viewed in the context of the current capital market environment.  Our current view on the attractiveness of stock factors augurs well for favorable returns to stocks with high sustainable levels of company profitability.

To read the full report please click here Migration Patterns In Company Profitability

Eric J. Weigel

Managing Partner, Global Focus Capital LLC

Feel free to contact us at Global Focus Capital LLC (mailto:eweigel@gf-cap.com or visit our website at https://gf-cap.com to find out more about our asset management strategies, consulting/OCIO solutions, and research subscriptions.

DISCLAIMER: NOTHING HEREIN SHALL BE CONSTRUED AS INVESTMENT ADVICE, A RECOMMENDATION OR SOLICITATION TO BUY OR SELL ANY SECURITY. PAST PERFORMANCE DOES NOT PREDICT OR GUARANTEE FUTURE SIMILAR RESULTS. SEEK THE ADVICE OF AN INVESTMENT MANAGER, LAWYER AND ACCOUNTANT BEFORE YOU INVEST. DON’T RELY ON ANYTHING HEREIN. DO YOUR OWN HOMEWORK. THIS IS FOR INFORMATIONAL PURPOSES ONLY AND DOES NOT CONSIDER THE INVESTMENT NEEDS OR SUITABILITY OF ANY INDIVIDUAL. THERE IS NO PROMISE TO CORRECT ANY ERRORS OR OMISSIONS OR NOTIFY THE READER OF ANY SUCH ERRORS

Is it Really All About Oil?

oil&stocks levels

A large number of stories in the financial press this year have revolved around the relationship between equity prices and oil.  In fact some commentators have focused on a recovering oil price as the key lynchpin for rising equity prices.

As an example, the Wall Street Journal published an article this year “Oil, Stocks at Tightest Correlation in 26 Years”. Many other publications and strategists have written pieces this year noting the close relationship between oil prices and equity index performance.

The human mind is conditioned to look for patterns and in the tumult of early 2016 the oil market meltdown started playing a leading role in explanations of why global equity markets were under stress.  But as any econometrics professor will say “correlation is not causation“.

In this note we look at the sensitivity of asset class returns to changes in the price of oil.  We take a risk management perspective and find that while oil price sensitivity is significant when analyzing one-on-one relationships, the effect is close to zero and statistically insignificant in a multivariate context.

Eq Beta to OilWhat you see is not always what you get.  We conclude that rising oil prices have little long-term significance for broad equity market prospects and that a rising oil price is more of a reflection of supply curtailment efforts.


The key lesson to us from our analysis is that commonly heard explanations for asset return drivers are often incomplete and in some cases highly misleading.

Every market environment has its own context and no single factor in isolation will ever be able to fully explain the complexities of market behavior.  Even in hindsight it is often hard to pin down a story that holds up to serious scrutiny.

Best to stay humble and realize that over shorter time periods capital markets will always be subject to a lot of noise of no material significance to long-term investors.

Click here to download the report: Is It All About Oil

Sincerely,

Eric J. Weigel
Managing Partner and Founder of Global Focus Capital LLC

eweigel@gf-cap.com

Global-Logo

Low Volatility – One Factor or Several?

park-bench-waterfall-1202609-639x427Once a month in our Equity Observer  publication we share our analysis of what stock selection factors are working.  This year the best performing factor in our global sample is “low volatility”.

The issue of what constitutes a factor will be endlessly debated, but while “low vol” does not quite rank up there among academics with the original Fama-French-Carhart variables (market, size, value, momentum) there is nevertheless a growing investor demand for lower volatility strategies.

The growing demand for “low vol” strategies does not seem entirely driven by the performance of these strategies relative to core benchmarks.  For example over the 2015-2013 period the S&P Low Volatility Index under-performed the S&P 500 core index by 3.4% annualized.  Yet demand for these strategies appears to have grown as manifested by the large number of new ETF’s launches in this space.

Investors seem particularly interested in the capital preservation characteristics of “low vol” strategies and appear willing to sacrifice returns during the good times in return for less pronounced equity market downdrafts.

Low volatility strategies seem here to stay.  Given their market beating returns thus far in 2016 it is reasonable to expect growing interest.  We therefore analyze our global sample of 13,000 stocks to ascertain the basic characteristics of low volatility stocks. Vol_decile

Stocks in the lowest volatility decile have an average return volatility of 20%

Higher volatility stocks exhibit low levels of market sensitivity (beta)

During periods of equity market stress ‘low vol” strategies should out-perform broad market indices

The lowest volatility decile enjoys the highest current yields while the “high vol” names in Decile 10 barely register for income

Lower volatility stocks have lost their historical valuation advantages.  The growing demand for ‘low vol” and its close cousin dividend income have eroded the typically lower valuations seen in lower volatility sectors and stocks.

low vol returnsEven after adjusting for sector and region/country effects we observe a strong monotonic relationship in YTD returns across volatility deciles.

The lowest volatility stocks (Decile 1) have had the highest 2016 returns while the highest volatility stocks have shown the greatest losses.


Our general conclusion is that “low volatility” strategies play a useful role for investors looking to provide short-term downward protection in their equity portfolios.  However, we think of “low vol” as part of a package of stock attributes designed to lessen market exposure during periods of equity market stress.  These strategies along with lower betas, higher yields and exposure to more stable sectors should exhibit lower levels of downside capture.

Investors worried about equity market downturns should not view these strategies as a substitute for properly assessing and managing the risk of their overall portfolios.

Click here to download the report: Low Volatility – One Factor or Several?

Sincerely,

Eric J. Weigel
Managing Partner and Founder of Global Focus Capital LLC

eweigel@gf-cap.com

Global-Logo

HTML Snippets Powered By : XYZScripts.com